Violence & Safety
Violence may occur in many ways: physical, sexual, mental, emotional, and more. Incarceration rates for women overall have declined in Massachusetts over the last decade. The COVID-19 pandemic worsened existing inequities and created additional barriers for domestic violence survivors seeking support.
Provider Sexual Crime Reports
In MA, one way incidents of sexual violence are measured is through the completion of Provider Sexual Crime Reports (PSCRs). Typically, a medical provider completes a PSCR when an individual seeks medical attention (most often in a hospital/medical center) following a sexual assault.
These data are based on those individuals who sought medical attention after a sexual assault, where a PSCR was completed, and the institution submitted the reports to Executive Office of Public Safety and Security (EOPSS). A higher number of cases from a particular county could signify a higher incidence of sexual violence, but it could also signify a higher rate of help seeking and/or PSCR completions and submissions.
Distribution of PSCRs in Western MA
2017–2018
| Number of PSCRs | Percent of PSCRs | |
|---|---|---|
| Franklin | 15 | 4% |
| Hampshire | 70 | 18% |
| Berkshire | 91 | 23% |
| Hampden | 218 | 55% |
Percent
of PSCRs
Source: MA EOPSS, PSCRs 2017-2018
Sexual Violence
Sexual Violence Among Massachusetts Adults Aged 18-64, 2021
Source: Massachusetts Department of Public Health, 2021
Nationally, women and transgender people experience GBV (gender-based violence) at higher rates than the general population, with 44% of female survey respondents, 25% of male respondents, and 47% of transgender respondents nationally reporting sexual violence over the course of their lives.
Sources:
Smith SG, Zhang X, Basile KC, Merrick MT, Wang J, Kresnow M, Chen J. The National Intimate Partner and Sexual Violence Survey (NISVS): 2015 Data Brief – Updated Release. Atlanta, GA: National Center for Injury Prevention and Control, Centers for Disease Control and Prevention; 2018.
James SE, Herman JL, Rankin S, Keisling M, Mottet L, Anafi M. (2016). The Report of the 2015 U.S. Transgender Survey. Washington, DC: National Center for Transgender Equality; 2016.
Comparison of statewide data from the Youth Risk Behavior Survey (YRBS) conducted in 2019 and 2021 indicate that female students continue to experience much higher rates of sexual dating violence than male students, and the situation has worsened.
Source: Donna St. George. “Teen girls ‘engulfed’ in violence and trauma, CDC finds.” Washington Post. February 13, 2023.
The 2021 survey results also found that 11% of high school females and 3% of high school males in the state had been forced to have sexual intercourse at some point in their life already.
Source: Donna St. George. “Teen girls ‘engulfed’ in violence and trauma, CDC finds.” Washington Post. February 13, 2023.
Discipline
Ratio of Student Discipline to Enrollment by Selected Gender and Race/Ethnicity, Massachusetts (2021–22)
For each circle, the number shows the rate that group is disciplined relative to that group’s enrollment. The larger the circle, the greater the reported inequity.
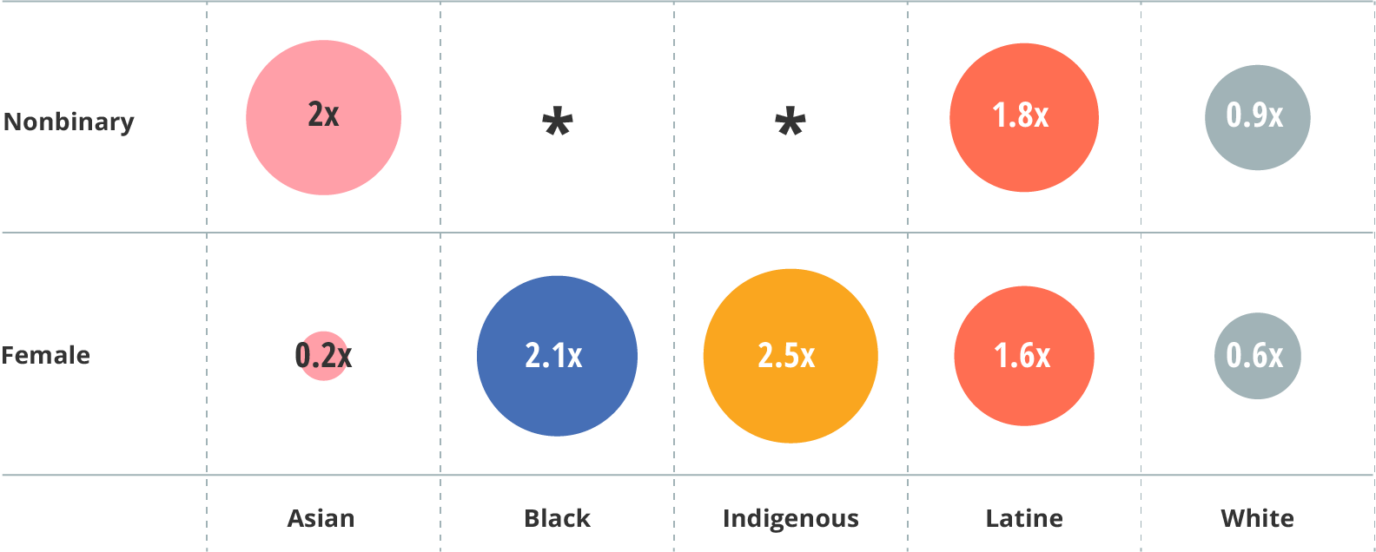
Source: Department of Elementary and Secondary Education, 2023.
Note: * indicates insufficient data for Black and Indigenous nonbinary students. Additionally, low numbers, especially for nonbinary students, and variable reporting by individual districts are existing limitations.
Tip for interpretation: For each circle, the number shows the rate that group is disciplined compared to that group’s enrollment. For example, the blue circle with 2x shows that nonbinary Asian students are disciplined at double the rate of their enrollment, suggesting disproportionate discipline.
People Detained Pretrial Statewide
In Massachusetts in 2022, only 3% of people in the Department of Corrections jurisdiction were women, yet women make up 62% of pretrial detainees. This shows that women are held at a significantly higher rate than men.
People in DOC Jurisdiction
-
Women 3%
-
Men 97%
Pretrial Detainees
-
Women 62%
-
Men 38%
Source: Cannata N, Matthews H, Desrochers B, et al. Massachusetts Department of Correction. Published online 2021.