Employment & Earnings
While the pay gap locally has gradually narrowed over time, it still exists, particularly for Black, Indigenous, and women of color (BIPOC). BIPOC women also experienced higher rates of unemployment, especially in Hampden County. Women with young children had a harder time economically during and after the pandemic, often because of the lack of affordable childcare. Many transgender and gender diverse job seekers, as well as immigrants, have experienced discrimination in hiring and employment. The lack of stable, affordable housing challenges economic security.
Education
Across all four counties of Western MA, women and girls completed higher levels of education than men and boys.
Educational Attainment by Gender and County
Educational attainment is an important factor in reducing poverty and expanding opportunity. Women continued to outpace men in level of education across all four counties. In the chart below, college attendance is measured by None (no college), Some (some college or associate degree), and Completed (bachelor degree or higher).
U.S. Census, ACS, 2021 Five-Year Estimates, for population 25 years and older
Gender Wage Gap
Academic achievement among women continues to show growth, and regionally women are completing higher levels of education than their male counterparts. However, women continue to participate in the labor force at lower rates than men, and, on average, continue to earn less than men.
Percent Participation in Labor Force by Gender and County
| Berkshire | Franklin | Hampden | Hampshire | |
|---|---|---|---|---|
| Women | 79% | 77% | 73% | 79% |
No data available for gender diverse people. Source: U.S. Census Bureau, American Community Survey, 2016-2021.
Women’s Earnings Proportional to Men’s by County
Based on past 12-month median income
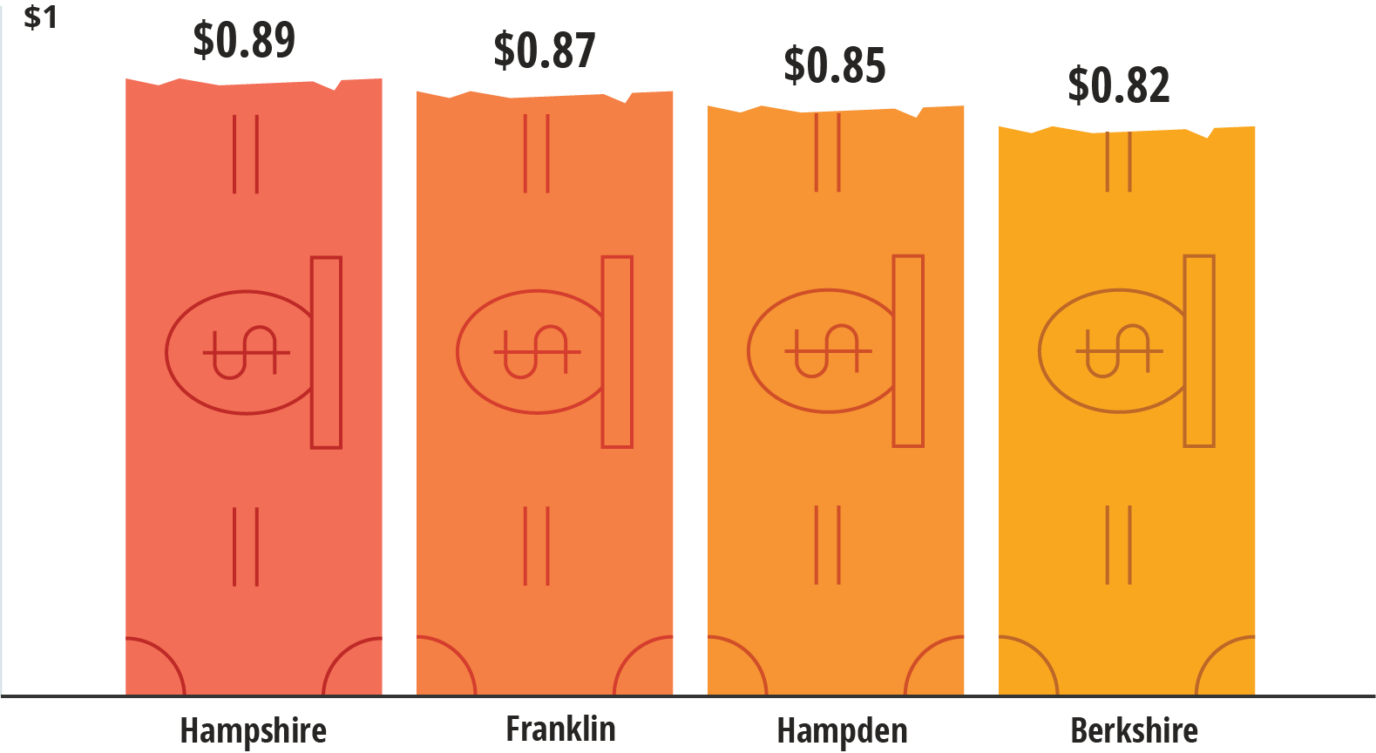
Source: U.S. Census, ACS, 5-Year Estimate 2013-2017
Women’s 12-Month Earnings Ratios Compared with Every Dollar Men Earned by Educational Attainment and County
| Less than high school graduate | High school equivalent | Some College or Associate’s Degree | Bachelor’s Degree | Graduate or Professional Degree | |
|---|---|---|---|---|---|
| Berkshire | 0.64 | 0.68 | 0.76 | 0.72 | 0.75 |
| Franklin | 0.84 | 0.55 | 0.75 | 0.79 | 0.74 |
| Hampden | 0.67 | 0.66 | 0.66 | 0.76 | 0.83 |
| Hampshire | 0.64 | 0.68 | 0.78 | 0.73 | 0.76 |
Source: U.S. Census, ACS, 5-Year Estimate 2013-2017
Women’s 12-Month Earnings Ratios Compared with Every Dollar White Men Earned by Race/Ethnicity and County
Source: U.S. Census, ACS, 5-Year Estimate 2013-2017
Gender pay gaps are widest among Latina, Indigenous, and Black women. The wage gap is also inequitable for LGBTQIA+ workers, especially those of color, Indigenous, and/or trans. Nationally, the greatest pay gap based on gender identity is for trans women, who earn only 60 cents of the typical worker’s dollar in wages.
Source: County Health Rankings and Roadmaps. Connecting the Gender Pay Gap to Health. Accessed on April 6, 2023.
Female Median Earnings by Selected Race/Ethnicity and County, 2021
Source: U.S. Census, ACS 2021 1-Year Estimates. Note that Black female median earnings is missing for Franklin County
Female Unemployment Rate by Selected Race/Ethnicity, Hampden County, 2012–2021
Source: U.S. Census, ACS Five-Year Estimates. Note that data for Native Hawaiian and Other Pacific Islander were incomplete and therefore omitted.
A 2020 Oxfam analysis found that if all American women earned minimum wage for the unpaid work they do around the house and caring for relatives, they would have made $1.5 trillion in 2019.
Source: Gus Wezerek and Kristen R. Ghodsee. Women’s Unpaid Labor is Worth $10,900,000,000,000. New York Times. March 5, 2020. Estimate based on methods used by Oxfam in its report, Time to care: Unpaid and underpaid care work and the global inequality crisis. January 2020.
The 2015 U.S. Transgender Survey data for Massachusetts (n=1,195) found that one in five transgender respondents who sought or had employment reported hiring or workplace discrimination.
Source: U.S. Transgender Survey, 2015.
Acknowledgements
Please visit the “About this Research” page to view acknowledgments related to these data.
Dropout Rate
Across the four counties, for the 2017-2018 school year, girls had lower rates of dropping out of school than their male counterparts. However, dropout rates varied across the region.
Dropout Rate by Gender and Region, 2019
Lower dropout rates among female students were consistent with statewide data.
Source: Massachusetts Department of Elementary and Secondary Education. 2017-2018 Dropout Rates. Available at: www.doe.mass.edu/infoservices/reports/dropout/. Accessed. April 5, 2019.