Demographics
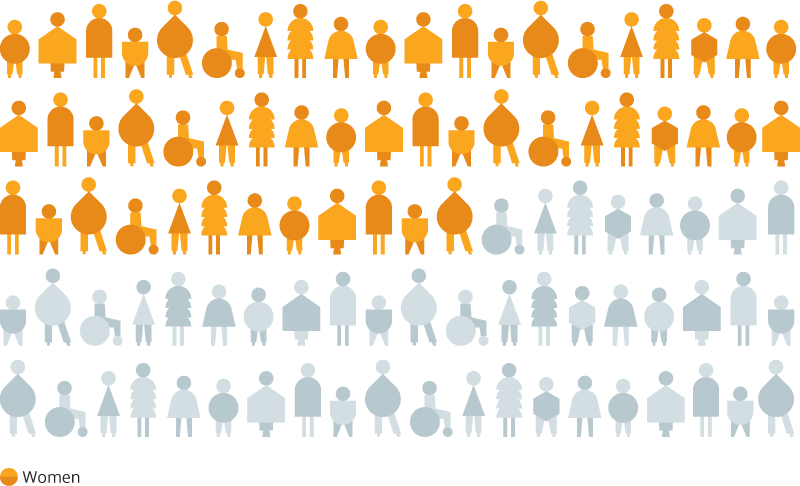
Women and girls make up just over half of the population of Western Massachusetts. More than half of those individuals live in Hampden County. Close to half of Hampden County women identified as Black, Indigenous, or a person of color (BIPOC). Across the region, the proportion of Latina women especially grew.
Geographic Distribution
Western MA: Women and Girls Make Up Over Half of the Population
Population data for Transgender people in Western MA is not available. Source: U.S. Census Bureau, American Community Survey (ACS), 2021 five-year estimates.
Statewide: Transgender People Make Up About 1% (43,000 people) of the Population
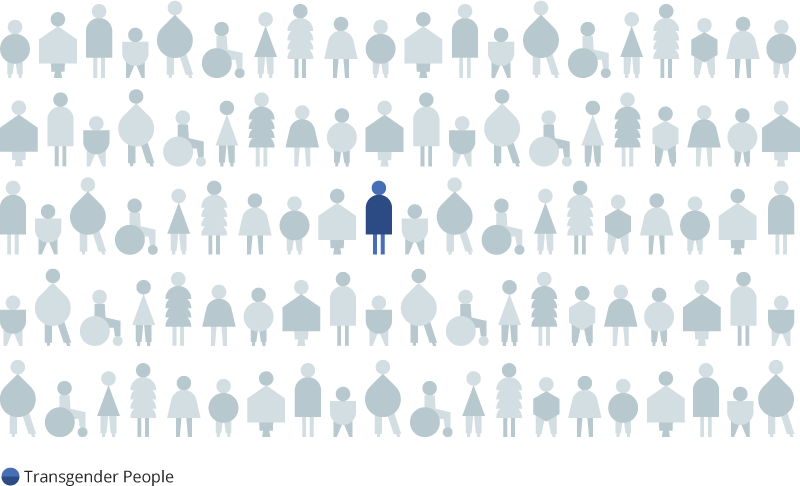
Source: Herman, JL, Flores, AR and O'Neill, KK. How Many Adults and Youth Identify as Transgender in the United States? UCLA School of Law, Williams Institute, June 2022.
More Than Half of the Region’s Women & Girls Reside in Hampden County
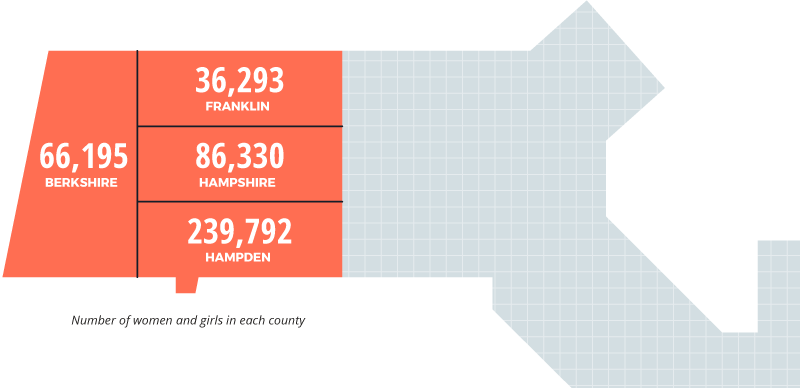
Source: U.S. Census Bureau, American Community Survey (ACS), 2021 five-year estimates.
The proportion of female residents with disabilities is higher than the statewide level.
Western Massachusetts
16%
Statewide
12%
Source: U.S. Census Bureau, American Community Survey (ACS), 2021 five-year estimates.
Age Demographics
Percentage of Women and Girls in Western MA, by County
| Berkshire | Franklin | Hampden | Hampshire | |
|---|---|---|---|---|
| Under 18 | 16% | 17% | 20% | 14% |
| 18–65 | 59% | 59% | 62% | 68% |
| 65+ | 25% | 24% | 18% | 18% |
Source: U.S. Census Bureau, American Community Survey (ACS), 2021 five-year estimates.
Female Population Projections by County, Age 65+, 2010–2040
Values are projections based on Census 2010 data
Source: UMass Donahue Institute, Massachusetts Population Estimates Program, Population Projections.
Racial & Ethnic Diversity
Racial Diversity Among Women and Girls in Western MA
Western
MA
In Western Massachusetts, approximately 26% of the female population identified as women and girls of color.
-
White 66%
-
Latine 16%
-
Two or More Races 7%
-
Black 5%
-
Asian 3%
-
Other 3%
-
American Indian and Alaska Native <1%
-
Native Hawaiian and other Pacific Islander <1%
Berkshire
-
White 84%
-
Latine 5%
-
2+ 5%
-
Black 2%
-
Asian 2%
-
Other 2%
-
AI/AN <1%
-
NH/PI <1%
Franklin
-
White 88%
-
Latine 4%
-
2+ 4%
-
Black 2%
-
Asian 2%
-
Other 1%
-
AI/AN <1%
-
NH/PI <1%
Hampden
-
White 54%
-
Latine 24%
-
2+ 8%
-
Black 8%
-
Asian 2%
-
Other 4%
-
AI/AN <1%
-
NH/PI <1%
Hampshire
-
White 80%
-
Latine 6%
-
2+ 5%
-
Black 2%
-
Asian 5%
-
Other 1%
-
AI/NH <1%
-
NH/PI <1%
Source: U.S. Census, ACS, 2017 1-Year Estimate
Estimated Racial/Ethnic Composition of Transgender Adults in Massachusetts, 2022
Massachusetts
-
White 64%
-
Latine 16%
-
Black 8%
-
Asian 8%
-
All others 5%
Notes About Low Numbers
When examining data across communities and disaggregating by race and ethnicity, data were unavailable for some populations because of the smaller population sizes in some parts of Western Massachusetts and the small number of people of color living in some communities.
Acknowledgements
Please visit the “About this Research” page to view acknowledgments related to these data.