Poverty & Opportunity
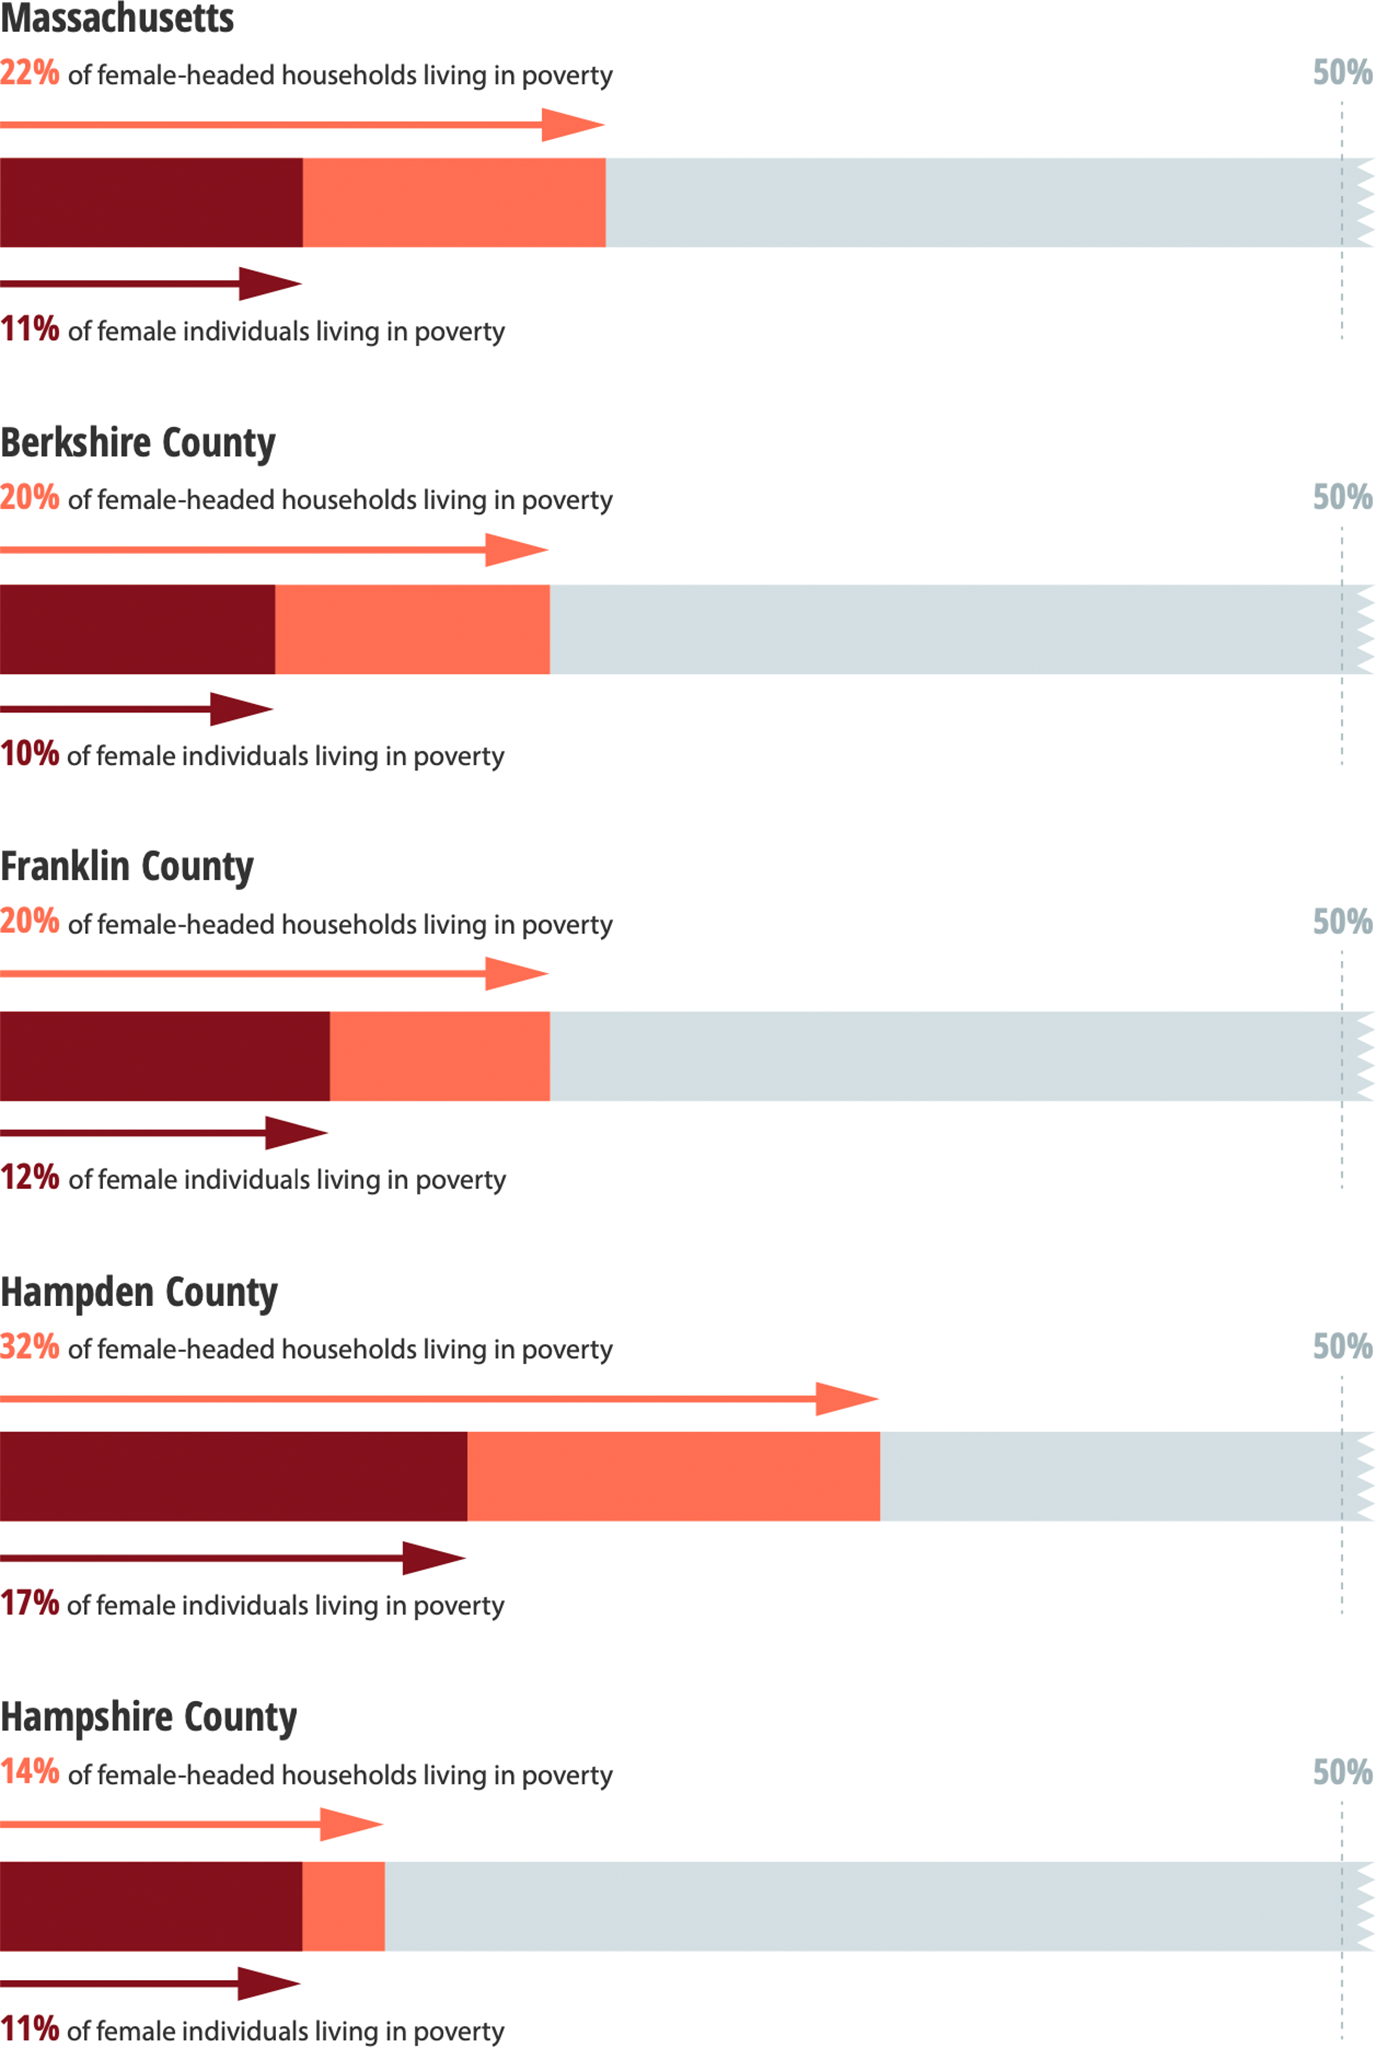
Regionally, the female poverty rate varied by county and demographic group. In Hampden County 23% of the girls in the county and more than 30% of female-headed households were living below the nationally calculated poverty rate, as well as 1 in 3 Latina residents. In Berkshire and Hampshire Counties the poverty rates have been declining over the last several years. Women continued to outpace men in educational attainment and have made gains in representation across many teaching and leadership positions in education.
Poverty
Female Poverty Rates by County, 2012–2021
Source: U.S. Census, ACS 2021 Five-Year Estimates.
Poverty among Female Individuals and Female-Headed Households, by County, 2021

Source: U.S. Census, ACS 2021 Five-Year Estimates.
Poverty Rates by Race/Ethnicity, by County, 2021
Source: U.S. Census, ACS, 2021 Five-Year Estimates. Note that data for Native Hawaiian and Other Pacific Islander were missing for two counties and therefore omitted.
Business
Women’s Representation in Top Massachusetts Corporations, 2019-2022
Source: Women’s Power Gap, Diversity Among Executive Leadership at Massachusetts’ Largest Public Companies, 2023. Note: CEOs are the Chief Executive Officer for each company. Executive leadership team is a group of leaders as identified on each company’s website. The makeup and size of the executive leadership team varies by company.
Gender Gap on the Path to the Corner Office
CEOs
-
Women 8%
-
Men 92%
Executive Leadership
-
Women 29%
-
Men 71%
Source: Source: Women’s Power Gap, Diversity Among Executive Leadership at Massachusetts’ Largest Public Companies, 2023 Note: Launch Positions are COO/presidents/division heads
According to a 2019 Nonprofit Board Census commissioned by the Boston Club, executive positions such as CEO and CFO show stable representation for women. Only 26% of the 150 organizations had women CEOs, and less than 7% of CEOs from the largest 148 Massachusetts nonprofits were verified as people of color.
Source: Simmons University. Opportunities Abound Intentionality Needed: The 2019 Census of Women Directors and Chief Executives of Massachusetts’ Largest Nonprofit Organizations. The Boston Club. Published online 2019.
STEM
Percent of Jobs Held by Women in STEM in Western MA
Source: U.S. Census Bureau ACS EEO Occupation by Sex and Race/Ethnicity for Residence Geography, 2018 5-Year Estimate (ALL01R/ALL01RC)
Percentage of All Female Employees in STEM Occupations in Western Massachusetts, by Race/Ethnicity
Source: U.S. Census Bureau ACS EEO Occupation by Sex and Race/Ethnicity for Residence Geography, 2018 5-Year Estimates (ALL01R/ALL01RC)
The term “STEM education” refers to teaching and learning in the fields of science, technology, engineering, and mathematics. —Science, Technology, Engineering, and Mathematics (STEM) Education: A Primer
Citation: Gonzalez, H. B., & Kuenzi, J. J. (2012, August). Science, technology, engineering, and mathematics (STEM) education: A primer. Washington, DC: Congressional Research Service, Library of Congress.
Healthcare
Healthcare is one of the largest employment sectors in Western MA. Leadership analysis of the largest non-governmental hospitals and healthcare systems showed at least 41% of leadership positions are held by women.
Educators & Administrators
Teachers
Although the proportion of teachers of color was highest in Hampden County, this rate was far from representative of the diversity of the student body.
Source: Massachusetts Department of Elementary and Secondary Education, 2023
Principals & Heads of School
Source: Massachusetts Department of Elementary and Secondary Education, 2023
Superintendents
Source: Massachusetts Department of Elementary and Secondary Education, 2023
Average Higher Education Leader Compensation in Massachusetts by Sex, 2019
| Male | Female | $ Amount More Males Were Paid | % More Males Were Paid | |
|---|---|---|---|---|
| President | $474,196 | $443,811 | $30,385 | 7% |
| Provost | $352,091 | $277,373 | $74,718 | 27% |
| All Others | $306,582 | $234,607 | $71,975 | 31% |
| Total | $330,712 | $257,355 | $73,357 | 29% |
Source: Women’s Power Gap in Higher Education, 2019.
Note: “all others” includes senior academic and administrative leadership.